
Understanding Company Accounts

This post is part of Investigating Companies: A Do-It-Yourself Handbook. Read, download or purchase the whole book here.
Companies are required by law to publish a summary of their finances every year. These publications are called their annual accounts. They reveal more about a company’s finances than any other public source. This section is an introduction to understanding them and explains the language they use and the principles they are based on.
See section 3.1 for how to get accounts from Companies House.
BALANCE SHEET
Also called the Statement of Financial Position, the balance sheet is the central document of a company’s accounts – everything else relates to it.
It is a table showing a company’s assets, liabilities and shareholder’s equity on a particular day, and their value:
o Anything a company owns or is owed is called an asset
o Anything a company owes is called a liability
And, following on from section 2.5, the value of the shareholder’s equity is the difference between the value of its assets and its liabilities (see page 35).
You can use the so-called ‘balance sheet equation’ (accountants love equations) to work out the equity:
Assets – liabilities = equity
The balance sheet is presented with this equation in mind. Let’s say Mrs Jones has the following assets and liabilities:
ASSETS: House £100,000, Car £10,000, Computer £400, Loan to brother £5,000, Cash in the bank £5,000, Cash in her wallet £100
LIABILITIES: Mortgage £80,000, Bank loan £10,000, Loan from sister £4,000, Credit card debt £1,000, Electricity bill £500, Student loan £20,000
Her balance sheet would look like this:
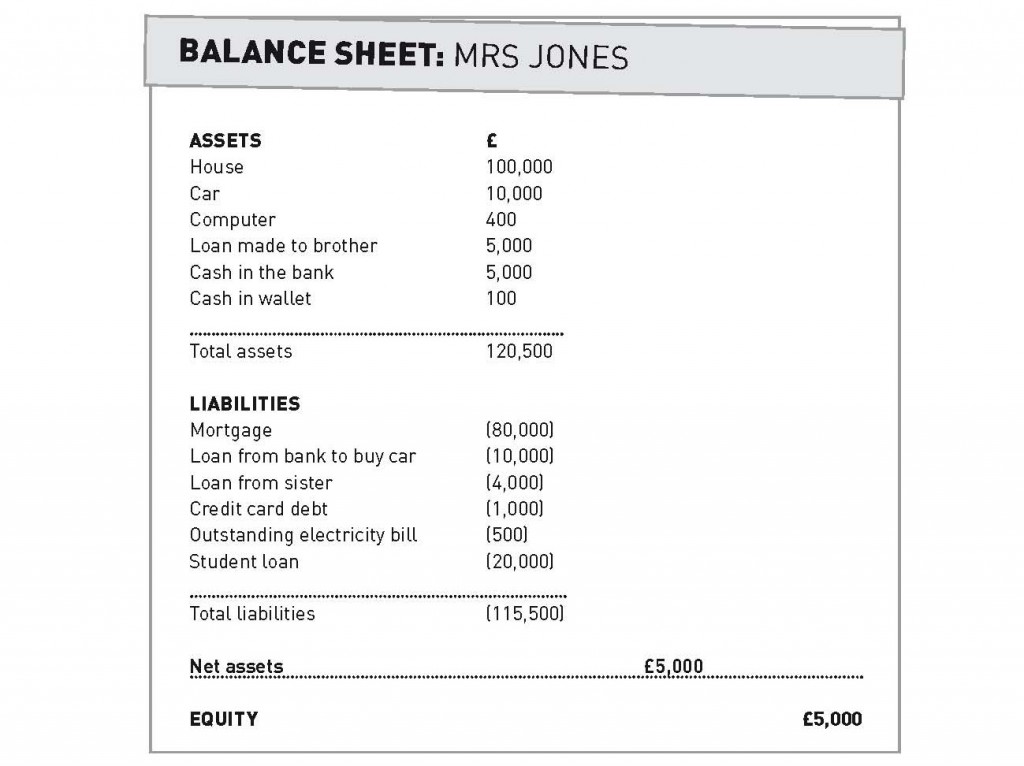
This clearly shows the difference between her assets and liabilities, and therefore the value of her equity. Note that:
- If a number in the accounts is in brackets it just means it’s negative. Brackets are used because minus signs can be mistaken for dashes.
- Net just means the value of something after all relevant deductions have been made. In this case, net assets are assets minus liabilities.
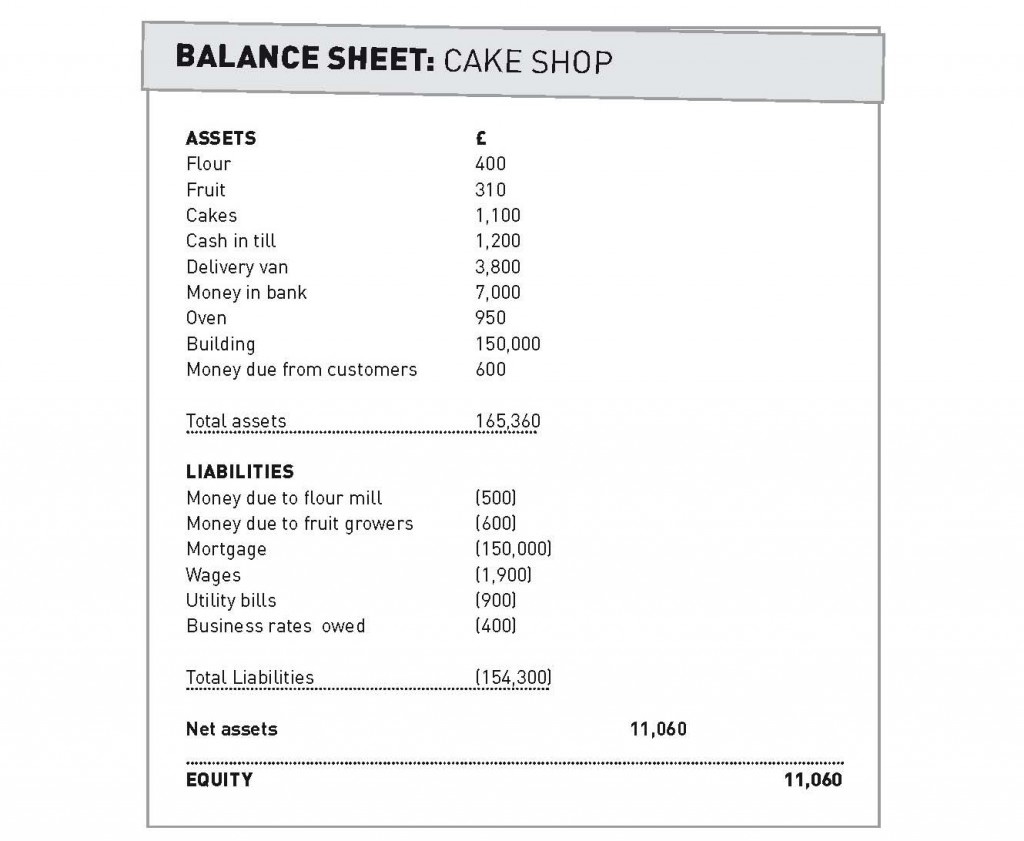
The principles behind a company’s balance sheet are the same. Let’s say that the cake shop introduced in the last section has been going for a couple of years. Its balance sheet might look like that below. Notice that its liabilities include everything it owes (such as heating bills or payments to suppliers) to anyone – not just the loans or bonds it owes to banks or investors. In accounts, anyone the company owes is called a ‘creditor’.
Note the notes: look at a real set of accounts and you’ll see small numbers between the descriptions and the values of items. These refer you to a note further back in the accounts, which will explain that item further. You should be reading these as you’re going through the balance sheet and the other statements at the front of the accounts as they’ll give extra details to help you understand each item. Get used to reading accounts with your thumbs and fingers keeping your place in a few pages at a time. See below for more on the notes.
CATEGORISING THE BALANCE SHEET
Most companies will have far too many individual assets and liabilities to list them all like we did with the cake shop. Instead, they will be grouped together into four main categories, based on whether the asset or liability will be held for less than a year (current) or more than a year (non-current):
o Fixed assets: assets that the company will have for a period of time longer than a year, for example property or machinery. For the cake shop, the building, oven and car would be fixed assets. These are also called non-current assets or capital assets.
o Current assets: assets the company expects to sell or dispose of within a year, for example stock or money owed from customers. For the cake shop, these would be flour, fruit, cakes, cash in the till and money in the bank, unless it was a long-term savings account not readily accessible.
o Creditors – amount falling due within one year: liabilities that the company expects to pay within a year, for example utility bills or money owed to suppliers. Also called current liabilities.
o Creditors – amount falling due after one year: liabilities that the company expects to pay after a year, for example long-term bank loans, mortgages, bonds. Also called non-current liabilities.
Broken down into these categories, the cake shop’s balance sheet would look like that on page 43 (real accounts also show the company’s finances from the previous year’s accounts to help compare and contrast).
Notice that the equity on the cake shop’s balance sheet has been further broken down to show how the company came to that position.
We can see from this that the two friends decided to invest £7000 between them when the business started.
The retained earnings shows how much the cake shop has made over its life up to that point. We can see that the cake shop lost money – £900 – in its first year. In the second year, its assets increased by more than its liabilities to increase its total equity to £11060. As its retained earnings increased from -£900 to £4,060 we can work out that it must have made a profit of £4960, assuming it didn’t pay out any dividends (see the Tesco case study below for the effects of this).
Remember that the figures on the cake shop’s balance sheet relate to the financial situation of the company on two particular days – 31 March 2011 and 2012. We know from this that the stock of flour, fruit and cakes, and the money owed to suppliers and staff on the two days in question have all increased over the year, and that the net result of that has been a profit. But we don’t know from the balance sheet the total amount of flour and fruit bought or cakes sold, or the total amount paid to the flour mill, fruit growers or staff. We only know the net result of all the transactions over the year.
The balance sheet therefore doesn’t break down how the cake shop made that profit – it doesn’t tell us about the company’s total revenue or expenditure over the course of the year. That is what the profit and loss account is for (see below).
NEGATIVE EQUITY: If a company has more liabilities than assets, it is said to be in negative equity. This affects individuals too. After the financial crash for example, a lot of people found themselves in negative equity, after their homes sharply declined in value, often to below the amount of their outstanding mortgages, making their possessions worth less than their debts.
Bigger companies have far too many assets and liabilities to list individually, so you’ll normally find the main categories are further broken down on real balance sheets into those below.
This means you won’t be able to understand them as intricately or as comprehensively as we could understand the cake shop, but you can usually still get a good picture of their situation.
FIXED ASSETS:
Tangible fixed assets: fixed assets you can touch – buildings, land, machinery and so on.
Intangible assets: assets that have no physical form but are considered valuable resources of the business, for example patents, trademarks or brand names. In most cases accounting standards do not allow intangible assets to be valued in accounts unless they have been purchased by a company. Google, for example, has some of the most profitable intellectual property around but if you look at its accounts you’ll find relatively few intangible assets, because they haven’t been bought or sold. This is to prevent companies inflating their balance sheets at will.
‘Goodwill’ is an intangible asset that shows the difference between the amount a company paid to acquire another company, and the ‘book value’ of the assets of the company it bought. If Company A pays £50,000 to buy Company B, for example, but Company B’s accounts say its assets are only worth £30,000, Company A will ‘book’ the remaining £20,000 as goodwill in its accounts.
Goodwill is then depreciated over its useful economic life much like a piece of equipment (see below), except that the depreciation is called “amortisation”.
How companies account for goodwill and intangible assets in general is too complicated to go into here. Check an accountancy textbook in your local library for more information.
Investments: any assets not used directly in the operation of a company’s business – for example, shares in other companies that aren’t part of the corporate group. If the investments are expected to be sold within the year, they would be classed as a current asset.
CURRENT ASSETS
Stock/Inventory: a company’s stock of unsold products, raw materials and other goods used in production.
Cash: in accounts, cash means any money the company can access quickly to pay people, so not necessarily just what the company has in physical notes or coins. Assuming the cake shop’s bank account was easily-accessible it would count as cash. If, however, it had a long term savings account that it couldn’t access for a few years, this wouldn’t be cash but would be classed as an investment.
Trade and other debtors/receivables: Money owed from customers or anyone else classed as a ‘debtor’ that the company expects will pay within a year. This can also include prepaid expenses – expenses that the company has paid in advance of receiving the services.
CURRENT LIABILITIES
Trade and other creditors/payables: money owed to suppliers (called vendors under IFRS regulations) and any other ‘creditors’ the company expects to pay within a year, which have already been delivered and invoiced to the company, but not yet paid for. This can also include unearned revenue/deferred income – cash the company has received in advance of providing goods or services (the company therefore recognises the goods or service it owes as a liability).
Current tax liabilities: any tax the company will have to pay within a year, consisting of Corporation tax on profits for the year, VAT, and employment taxes. A current tax asset represents tax the company expects to receive in the year.
NON-CURRENT LIABILITIES
Long-term borrowings: loans or bonds due to be paid back in more than one year. This, and the note attached to it, will give some details of lenders and the interest rates on the loans or bonds (see section 2.5).
Deferred tax liabilities: tax the company owes but will not pay this year. A deferred tax asset is tax the company expects to either receive back from the government, or be cancelled out by future tax it accrues. Deferred tax is complicated, but in broad terms it arises because companies like to ‘even things out’ between years – a bit like depreciation (see below). Don’t assume that large figures here are necessarily signs of aggressive tax avoidance. There are differences to the way expenditure is treated for tax, and the way it is treated for accounts, and this can give rise to large tax charges in one year, and low tax charges in another year. Deferred tax is a way of evening this out, so that the tax charge better reflects the actual profit for the year.
Provisions: if companies have assets they think may turn out to be worth less than currently recognised on the balance sheet, they can enter a provision for the amount they think they may eventually lose. Banks, for example, often enter provisions when they think they will not get back the full value of loans they have made.
EQUITY
Share capital: represents the total ‘face’ value of the shares a company has issued. This is a nominal amount that companies often set at £1 or another small amount. Plcs must have a minimum share capital of £50,000.
Share premium: the amount paid by shareholders to buy shares over and above the face value of the shares. If the face value of a company’s share is £1 but an investor paid £1,000 for it, the share premium would be £999.
Retained earnings: shows the ‘net’ earnings the company has made throughout its history. Increases or decreases according to the profit or loss made by the company in a particular year and how much has been paid out in dividends. Also called retained profit or the profit and loss account.
Big companies often now present a further Statement of Changes in Equity following the balance sheet to break down further the changes in the equity categories. This can be useful to see details of dividends to owners and other transactions with shareholders.
WORKING CAPITAL: Working capital is a measure of a company’s short-term financial strength and efficiency. It is calculated by deducting current liabilities from current assets. You’ll see that most balance sheets are laid out to show this calculation. The working capital ratio is worked out by dividing current assets by current liabilities.If current liabilities are higher than assets, that means it may have problems paying off short-term debts, while a consistently high working capital ratio may be a sign it’s not collecting money from customers very well.
SHARE VALUE: Don’t get confused by meagre-looking share capital or share premium amounts: because shares give you a share of the total equity and a company’s future earnings, and because of the difference between book and market value, they are usually very different from what the shares are actually traded for.
KEY ACCOUNTING CONCEPTS
ACCRUALS
Say the cake shop from the last section agrees to sell a big batch of cakes to a hotel on a Monday, and at the same time agrees that the hotel will only pay when the cakes have been delivered on the Wednesday. In accounting terms, the revenue from the cakes has been earned on the Monday – that’s when the deal has been made – so that’s when it would be entered (or ‘booked’) into the accounts. This is why the cake shop’s balance sheet has an entry for ‘money due from customers’ – they have already agreed to buy the cakes, they just haven’t paid for them yet.
This applies for expenses too. Say the cake shop receives an electricity bill on that same Monday. Even though the cake shop is not actually going to pay the bill until the week later, it would still book the bill amount as an expense for the Monday. Or take the wages item in the cake shop’s accounts. This shows that staff are still to be paid for the work they’ve done.
Therefore:
o Revenue is recognised in a company’s accounts when it is earned, not when the payment is actually received;
o Expenses are recognised in the accounts when they are incurred, not when they are paid.
THE GOING CONCERN ASSUMPTION
If a company folded shortly after its accounts had been drawn up, much of the information it had presented would have little practical basis. The company wouldn’t be able to pay the debts listed in the accounts, and people that owed the company money may be be unlikely to pay, for example.
Directors therefore have to state in their report at the front of the accounts that they believe their company will be a ‘going concern’ until the next accounting year, and that is not about to stop trading. If that is in doubt, they should show why it is a going concern (for example, by saying the shareholders have committed to investing more in the business, or the lenders have postponed repayment of a loan). The auditors should also state if they think there’s a risk over the company’s going concern status, or if they disagree with the directors. Phrases like ‘qualified opinion’ or ‘emphasis of matter’ may suggest there’s a problem.
DEPRECIATION
You may have noticed that the cake shop’s van and oven decreased in value over the year. This is because of depreciation. In accounting terms, this is recognising a reduction in the value of – or ‘writing down’ – an asset to reflect age and use. The more the cake shop uses the oven and the van, the less they will be worth.
If the van lasts, say, five years, then the effect of depreciation is to spread the cost of the van over the period in which it is used. If the van cost £5,000, then £1,000 depreciation would be taken off, and charged as an expense, every year. Unfortunately for the cake shop, the bank loan it used to buy the oven and van does not depreciate in the same way!
Instead of a company deciding how much of an asset’s value to write down each year, which creates opportunities for manipulation of the figures, and is against regulatory rules, assets are usually written down at the same rate each year (this is called straight-line depreciation).
BOOK VALUE AND MARKET VALUE
Of course, the cake shop could decide to sell the van after a few years and – because they’ve managed to keep it in pristine condition – get a better price than is shown in the accounts.
This is one example of how there may be a difference between the value of an asset in a company’s accounts – its ‘book value’ – and how much it could be actually be sold for – the market value. If both sides are clued up with all the necessary information about the van, the market value will also be its fair value.
This applies to a company’s overall worth. If a company is successful, its market value will usually be much higher than its book value in the accounts. Remember that investors buy shares in a company because of its potential future earnings, which may not be reflected by a company’s present-day accounts.
The price that a company’s shares are being bought and sold for may be very different to the figures you see in its accounts.
PROFIT AND LOSS ACCOUNT
A big company will make millions, perhaps billions, of individual sales and payments every year. Also called the income statement, the profit and loss account statement groups these into categories to show the total amount of sales the company has made, and how many expenses it has incurred. The difference between the two is the company’s profit or loss for the year, and will relate to the profit and loss account on the balance sheet (see the examples here and here for examples of how this works in practice).
The profit and loss account shows transactions made in the course of a company’s everyday operations.
It does not include money a company has borrowed or that the shareholders have invested. This is classed as capital, not revenue, as it has not been earned in the normal run of business. So-called capital expenditure – money spent on buying fixed assets – is also not included on the profit and loss account because these assets are not bought and sold, or ‘turned over’ in the normal run of business in the way that current assets are.
The profit and loss account will be at the front of the accounts, together with the balance sheet, of most medium to large companies.
In the UK, most profit and loss account statements will be broken down into four parts:
1. Gross profit = turnover – cost of sales
Turnover represents the amount made from all sales made during the accounting period (regardless of whether or not cash has been received yet – see above). Also called income or revenue.
Cost of sales represents the cost of making those sales. For a company like Tesco, this would include the cost of buying or making their products, running their shops and the wages of the staff working in the shops.
2. Operating profit = gross profit – operating expenses
Operating expenses include:
o Distribution costs: Packaging, postage and transport costs, for example.
o Administrative expenses: Money spent on the general running of a business or organisation, rather than on producing goods or selling services. For a supermarket like Tesco, this would include costs incurred in, say, the human resources and accounting departments but not their factories or shops.
o Depreciation: Recognises the decrease in an asset’s value over its life (see above).
o Amortisation: Like depreciation but for intangible assets (see above).
o Impairment: A reduction of the value of an asset but not one that occurs in a predictable way like depreciation. A piece of machinery that has broken and so no longer has an economic use will be written down or ‘impaired’ to its scrap value, for example. If a bank realises a customer is unlikely to pay back a loan – either in full or in part – it will recognise the money it would lose from this as an impairment expense in the income statement (while reducing the value of its loans in its balance sheet accordingly). Years after the credit crunch, impairments remain a common feature of many banks’ income statements.
3. Profit before tax = operating profit + other income – financing costs
o Financing costs: Money the company is paying in interest on the loans or bonds it has.
o Other income (or non-operating income): Any other income the company has made – usually interest or dividends it has received on investments or from subsidiary companies.
4. Profit for the year = profit before tax – corporation tax
(Note the corporation tax figure here is the tax the company has incurred for the year, not how much it has actually paid – this is found in the cash flow statement, below.)
The accounts of quoted companies will usually tell you the ‘earnings per share’ – how much each share has increased in (book) value over the year.
The accounts may say a proportion of the profit is attributable to a minority interest. This refers to the portion of a company’s equity that is not owned by the parent company. This will be less than 50% of its shares.
WHAT PROFIT TO LOOK AT: Which profit figure is most relevant will depend on what you’re looking for. The gross profit tells you how profitable the company’s basic business of making and selling whatever goods or services it offers is. Operating profit includes the cost of expenses necessary for the functioning of the business. Profit before tax adds in the cost of the company’s financing arrangements. A company’s profit margin is worked out by dividing net income by revenue (so the profit margin of a company with net income of £10 and revenue of £100 would be 10%).
Big companies often include a statement of comprehensive income or recognised gains and losses at the front of the accounts with the income statement. This includes any gains or losses that affect shareholders’ equity but are not part of the income statement. It includes things like gains or losses in the value of the company’s pension scheme, currency translation, or certain investments, depending on the standards applied by the relevant accounting jurisdiction. These should really all be included in the income statement as they affect a company’s retained profit. But because they are all very changeable and volatile – and because companies want to show consistent profits on their income statements – regulators allow them to be grouped together separately.
RETURN ON EQUITY: the business media and a company’s annual report will often talk about a company’s return on equity. It is a key measure of a company’s profitability and is the most common way for shareholders to assess how much of a return they’re getting on their investment. It is calculated as a percentage by dividing a company’s profit after tax with the total value of the shareholder’s equity.
SMALL FIRMS: accounting regulations often do not require smaller companies to present income or cash flow statements but you can still get some idea of their profits by looking at the change in the retained profit in the balance sheet from the previous to current year, although try to check if dividends have been paid, as they are also taken from the retained earnings (see here and here for examples of this).
CASH FLOW STATEMENT
The cash flow statement tells you how much cash the company has spent or received over the accounting period and relates to the cash asset on the balance sheet. Unlike the profit and loss statement, this includes cash spent or received through capital expenditure (the buying or selling of fixed assets) and financing. Remember that cash in accounts means any money the company can access quickly to pay people, and that running out of cash is the most common reason that companies go out of business (see section 2.1 and section 2.4). Common categories that a company’s cash transactions are grouped into on the cash flow statement include:
o Operating activities: net cash received from a company’s day-to-day operations. Because of the accruals basis of accounting, cash from operating activities is unlikely to be the same as the operating profit in the income statement. Over the whole life of the company however, they should always match up.
o Capital expenditure: cash from the buying and selling of fixed assets.
o Returns on investments or servicing of financing: cash paid out as interest on the company’s debt, or cash it has received in dividends or interest from shares it owns or loans it has made.
o Taxation: cash paid out as tax. Note that the cash flow statement shows cash paid for the previous period’s tax bill. This won’t be the same as the tax figure on the income statement, which shows a company’s tax charge from its activities for the accounting period just finished. These figures can be quite different so be careful that you don’t mix them up. If this is a positive amount, it is because the company has received money back from the government as a tax credit.
o Dividends paid: dividends paid out to shareholders.
o Financing: cash received from the raising of funds to run the business, for example in return for new shares or bonds issued or new loans taken.
COOKING THE BOOKS: When to book revenue and expenses often isn’t an exact science and the ambiguity can be used to manipulate results according to the needs of the company. As one example of many, technology firm Hewlett-Packard has recently concluded that Autonomy, the British software company it bought for more than £7.1bn, made 80% less profits than originally stated in its accounts, due to accounting irregularities by the former management team. You may spot signs of dodgy accounting like this – if the operating profit and operating cash flow are significantly different over a period of years for example – but, even if you’re an expert, this can be very hard to spot just from the published accounts. The auditors are meant to check for this so always read their report at the front of the accounts to see if they raise any doubt (although there are many cases – that of Enron most famously – of auditors not doing their job as stringently as they might).
NOTES TO THE ACCOUNTS
As explained above, the notes are an integral part of the accounts and most should be read in tandem with the primary statements. However, some notes don’t directly relate to the primary statements but still contain lots of important details. These include:
ACCOUNTING POLICIES
Usually the first or second note in the accounts, this tells you the particular criteria the company is using to draw up its accounts. It will include details of how they are calculating depreciation of assets, and if the accounts are consolidated, for example. It will also tell you how – if at all – the company is revaluing any of its assets.
SEGMENTAL ANALYSIS
Some companies will break down their revenue and expenditure across their operations – for example by country or sector. However, most of the time these do not disclose anything like the amount of information a full set of accounts would for each set of operations in each different area.
EMPLOYEES AND STAFF COSTS
This will tell you total numbers of employees, and their total wages and benefits paid. Big companies will often include social security costs. Some companies, and many public sector organisations, use this note to provide a detailed breakdown of the different levels of staff pay, and an overall average. This information may also be contained in their annual report, if they produce one (see section 3.1).
This should at least give you the details of what the highest paid director is making. Most big, public companies will have a much more detailed breakdown, though this will often be in their annual reports (see section 3.1). Directors often receive bonuses and pension contributions in addition to their salary, so be careful you don’t mix up the different figures.
This note explains how much was paid out to shareholders over the past year and how much has been agreed to be paid out over the next year. Be careful not to confuse the dividends that have been paid out in the accounting year, and the dividends proposed for the upcoming year (based on this year’s results). For quoted companies, the directors will propose an amount to be paid out and shareholders will vote on whether to accept it. If the accounts are prepared before the vote has been taken, they will usually show how much has been proposed to be paid. If you’re not sure, check the cash flow statement to confirm how much was paid out last year. See here for an explanation of dividends.
PENSIONS
This will show much credit or deficit the company’s pension scheme for its employees is in. How companies account for pensions is very complicated and this will often be a very long note.
Pensions can be very volatile and show significant deficits or credits that will get cancelled out the next year. This may come from slight changes in the equations that the actuaries who plan the scheme have used – for example assuming people will live for six months longer than previously anticipated.
SUBSIDIARIES
A list of the company’s subsidiaries – companies it owns more than 50% of the voting rights in – or at least all the major ones. This includes companies in the UK and around the world. Companies that the parent owns between 20% to 50% of are called associate companies.
The Financial Reporting Council regulator deems two companies to be related when one has control over the other or they are both “subject to common control” from the same source. In both consolidated and non-consolidated accounts, this note will show transactions between the company and its owners and any other commonly-owned companies. In an individual company’s accounts this will also show transactions with companies in the same group.
Transactions with directors are also included here, as are other companies the company owns or controls.
Always check this note if you suspect a company is avoiding tax as this is where you’ll find details of payments to any offshore companies the owners have that aren’t part of the group, although, as explained here, transactions with offshore companies within the group won’t show up here (spotting tax avoidance is too big a subject to include in this handbook, but check the tax figures on the profit and loss and cash flow statements, and this note and the subsidiary note for any offshore companies to get an idea of whether there may be something to look into).
One of the last notes should tell you who owns the company. If it is part of a group, this will tell you the immediate parent company and, if you’re lucky, the ‘ultimate’ owners of the group. See section 3.1 for more on finding company owners.
POST BALANCE SHEET EVENTS
This will show any significant changes to the company’s finances since the accounting period.
AUDITORS’ AND DIRECTORS’ REPORTS
Unlike a company’s annual report, the accounts of all but the smallest companies’ accounts have to be audited. An external, independent auditor is supposed to check the figures in the accounts are a ‘true and fair’ presentation of the company’s finances. They have to give their opinion on the validity of the accounts in a report at the beginning. If they have any doubt they will express a “qualified opinion” or an “emphasis of matter”. These are phrases to watch out for as they often suggest that the company is in some financial trouble.
Accounts also contain a report by the directors at the beginning. This is not audited and allows the directors to describe the company’s operations and the business context to the results. It also includes other information such as charitable and political donations. It will be very short if the company combines its accounts with an annual report (see section 3.1).
REGULATIONS
Over the years a common way for companies to present their accounts has developed, to allow investors and regulators to assess companies from around the world. They differ slightly from country to country, but all adhere to the broad criteria described here.
In the UK, accounting regulations – often called Generally Accepted Accounting Principles (GAAP) – are set by the Companies Act 2006 and the Financial Reporting Council, although all quoted companies and many bigger private companies use the International Financial Reporting Standards (IFRS), which are rules drawn up by the International Accounting Standards Board (IASB).
The most obvious differences are the names of some of the items in the accounts, which are noted throughout this section. The balance sheet, for example, is called the Statement of Financial Position in IFRS-compliant accounts. Where there are two names listed for the same item in this section, the first is the UK term, the second the IFRS.
There is no set day of the year that accounts have to be submitted for, though many follow the UK corporation tax year and draw them up for 31 March. However, the company has to stick to whatever day it picks. Companies have to get their accounts to Companies House within nine months of their accounting date.
If you see a company is late filing their accounts this might be a sign of financial difficulties or just disorganisation.
Most of the information in this section can also be used to understand the accounts of government bodies, charities and other non-corporate organisations.
CONSOLIDATED OR COMPANY ACCOUNTS?
For accounting purposes, companies are treated as being part of the same group when they are all ultimately owned and controlled by the same source, and are run as if they were a single economic entity.
As shown in section 2.5, the parent company of the Yorkshire Water group is Kelda Holdings Limited. That is owned by four different shareholders – banks and investment companies that have separate economic interests and sources of control. They are therefore not classed as being part of the Yorkshire Water group, which includes Kelda Holdings Limited and all the companies beneath it in the chain.
You should always be sure if you’re looking at the accounts of an individual company, or the ‘consolidated’ accounts of the whole group. Each individual subsidiary in the group will have its own accounts, detailing its own finances. The consolidated accounts merge all of these different accounts together, and cancel out all of the transactions between the companies in the group (they ‘net out’ the intra-group transactions, in the jargon).
To get your head round this, imagine how the finances of the family below would look if they were ‘consolidated’ together:
o A couple have a house worth £150,000 with a £130,000 mortgage still to pay off. They have £5,000 of credit card debts and they have lent their daughter £20,000.
o Their parents own a house worth £200,000 and have no debts.
o Their daughter owes £10,000 in gambling debts incurred over the last month and owes her parents £20,000 from the debts she ran up last year.
The ‘consolidated’ finances of the family as a whole would show:
o They own property worth £350,000 (couple’s house + parents’ house)
o They owe debts of £145,000 (couple’s mortgage, credit card debt + daughter’s gambling debts).
Clearly this is very different from any of their individual situations, which are obscured by the consolidation. An outside observer wouldn’t know that the extent of the daughter’s financial problems for example, because the loan between the couple and their daughter wouldn’t show up.
While you need to look at the consolidated accounts to get a picture of a company’s finances as a whole, they may not tell you enough about the financial flows between the individual companies in the group enough. If you want to look at how much money a company made overall last year, for example, you’d look at the consolidated accounts. To know what it is making in each area it’s working in, you need to get the accounts of the relevant subsidiary. But this isn’t always easy. There are regulatory exemptions that allow companies not to disclose their ‘intra-group transactions in certain circumstances, while some jurisdictions – such as Jersey, Switzerland, Cayman Islands and other tax havens – don’t require companies to even publish accounts. This allows companies to shift profits ‘offshore’ in ways that don’t show up in the group accounts and can make it very hard to find exactly where the money is, and enabling tax avoidance and other financial sleights of hand.
However, even if the parent company is registered offshore, you are still entitled to see its consolidated accounts if there are UK companies in the group of companies it is the head of. If the company does not publish these on its website, you can write to the company secretary, whose contact details should be listed at the end of the accounts, and request they send you a copy.
CASE STUDY: TESCO
As an example of the kind of things you can learn from accounts, let’s have a look at the 2013 accounts of supermarket giant, Tesco. Get hold of the 2013 Tesco Plc annual report (you can download it for free from their website, or from Companies House, for £1), so you can look at the notes that there’s not space to include here.
As this is a basic example, we just want to look at the company’s overall finances, so we first need to check we’re looking at the consolidated accounts.
The balance sheet, reproduced on the page opposite, is the cornerstone of the accounts, so let’s start here. It’s titled ‘Group’ so we know these are consolidated accounts, which, as we want to look at Tesco’s overall finances, are the most suitable.
The ‘£m’ at the top of each column means that all the figures are in millions (£’000s means thousands, and so on). The amounts are huge, and there are a lot more categories than were on our cake shop’s balance sheet, but the principles are the same. The balance sheet equation still applies and the value of the assets (£37 billion non-current assets + £13bn current assets = £50bn) are the same as the total liabilities (£33bn) and shareholder’s equity (£17bn) combined.
Now compare the 2013 figures with those of 2012. The value of Tesco’s assets went down by about £700m while its liabilities increased by about £500m. As a result, the shareholder’s equity decreased by £1.2bn, suggesting the company didn’t have such a good year in 2013. The most obvious change is in the retained earnings, which went down by around £1.5bn.
The income statement (page 59) helps to explain what has happened to the retained earnings.* That shows Tesco’s profitability did indeed take a hit, going down by more than £2bn and that Tesco made a loss of £1.2bn from what are called “discontinued operations”. To find out what they are we need to go to note 7, which explains these are losses made from its botched US expansion.
However even without that loss, its profits from continuing operations also went down significantly (from £3.2bn to £1.4bn). The main reason for that looks like an increase in the cost of sales. Tesco’s overall revenue actually increased in 2013, meaning it sold more goods. But the cost of producing the goods it sold increased by £1.5bn (in the annual report released with these accounts, the CEO blames it on investment in its UK stores, the Eurozone crisis and legislation restricting opening hours in South Korea, Tesco’s largest market outside the UK).
However, the company still made a profit, albeit a relatively meagre £120m. So why has the retained earnings on the balance sheet gone down by so much (by £1.2bn compared to a loss of £120m)?
To find out why, look at the statement of changes in equity on page 75 of the accounts. This shows the main reason for the equity decline is a £1.2bn dividend payout to shareholders.
Dividends are taken straight out of the company’s cash holdings and you can see the payout on the cash flow statement overleaf.* Tesco’s assets therefore went down, and as there was no change in its liabilities, its equity went down too.
Tesco’s directors know they haven’t had a great year but they seem to be worried about keeping the shareholders onside, so have kept their dividends at the same level as previous, more profitable, years. This has weakened the company’s overall financial stability, as equity has decreased in relation to debt, but the directors presumably believe they can get back to previous profit levels, and have decided they need to keep their investors sweet until then.
Tesco is hardly in financial trouble, but its accounts show it is having problems. It cannot keep paying out dividends like this if its profits don’t go back up, meaning it may be at risk of losing some major investors.
A company’s accounts then, can show vulnerabilities that may not otherwise be apparent.
* Don’t worry about the Non-GAAP measure statement or the Reconciliation of net cash flow to movement in net debt note beneath the income statement and the cash flow statements respectively. They provide additional information that Tesco wants to show investors, and they are not part of the main statements.
FURTHER READING
Accounts Demystified: The Astonishingly Simple Guide to Accounting by Anthony Rice is an excellent and accessible introduction to understanding accounts.
The Investigative Journalist’s Guide to Company Accounts by Raj Bairoliya, published by the Centre for Investigative Journalism, gives a critical guide to reading accounts, with lots of information and insight on how to spot a variety of accounting and corporate shenanigans.
The Investopedia, FT Lexicon and Wikipedia websites all describe and explain a range of financial and accounting terms and concepts.
For more detailed guides, check your local library for accounting textbooks.